Back
ProdX
The following are from a mobile medical companion application. ProdX used a connected patch that tracked medication ingestion, sleep, activity, and heart rate, with the goal being to allow persons with depression, bipolar disorder, and schizophrenia to track their progress over time via daily self-reports and patch-reported metrics. A physician-facing Web portal was also created to share information with patients' HCPs.
Overarching Goals
The company wanted to track medication ingestion and other measures to determine drug efficacy over time, especially for inconsistent cyclers who have trouble adhering to their medication regimen. To do this, we needed to collect self-reported mood over time, ideally on a daily basis, and, to achieve that, we needed to give users a good reason to continually engage over time by providing trends and insights about behavior and medication.
Optimizing the interaction design, data collection and visualization, and overall experience were all crucial to our success. My role on this project was to deliver features currently in our pipeline while figuring out how to achieve the above objectives as we continuously build new features.
Giving Back More…
This presentation is a deep dive into some concepts to increase engagement with users over the short term and long term. Inspired by games—but not merely shallow gamification—our aim was to provide obvious value to users for persistent engagement by providing them with insights that we've gleaned from their continued self-reporting, medication adherence, and behavior.
Our basic principle: Give more than we take. Whatever the user does, maximize the output and value. If you have the stomach or time for a twelve-minute video, it covers some interesting topics and also demonstrates the way I communicate strategy and complex ideas.
Demand Less of Users
When we ask so much of our users, we need to be conscious of what we really need from them and whether we can speed up the process to completion for them.
Our daily check-in process did not begin as a user-friendly one. It was unnecessarily wizard-ified with a multi-page process and didn't allow users to check-in multiple times per day—a goal given to our team by stakeholders. We needed to make the process feel faster and to allow for multiple entries per day. I also noticed that there was an opportunity to allow users to make their entries retrospectively like a diary—when it makes sense for them and their busy (or otherwise difficult) lives.
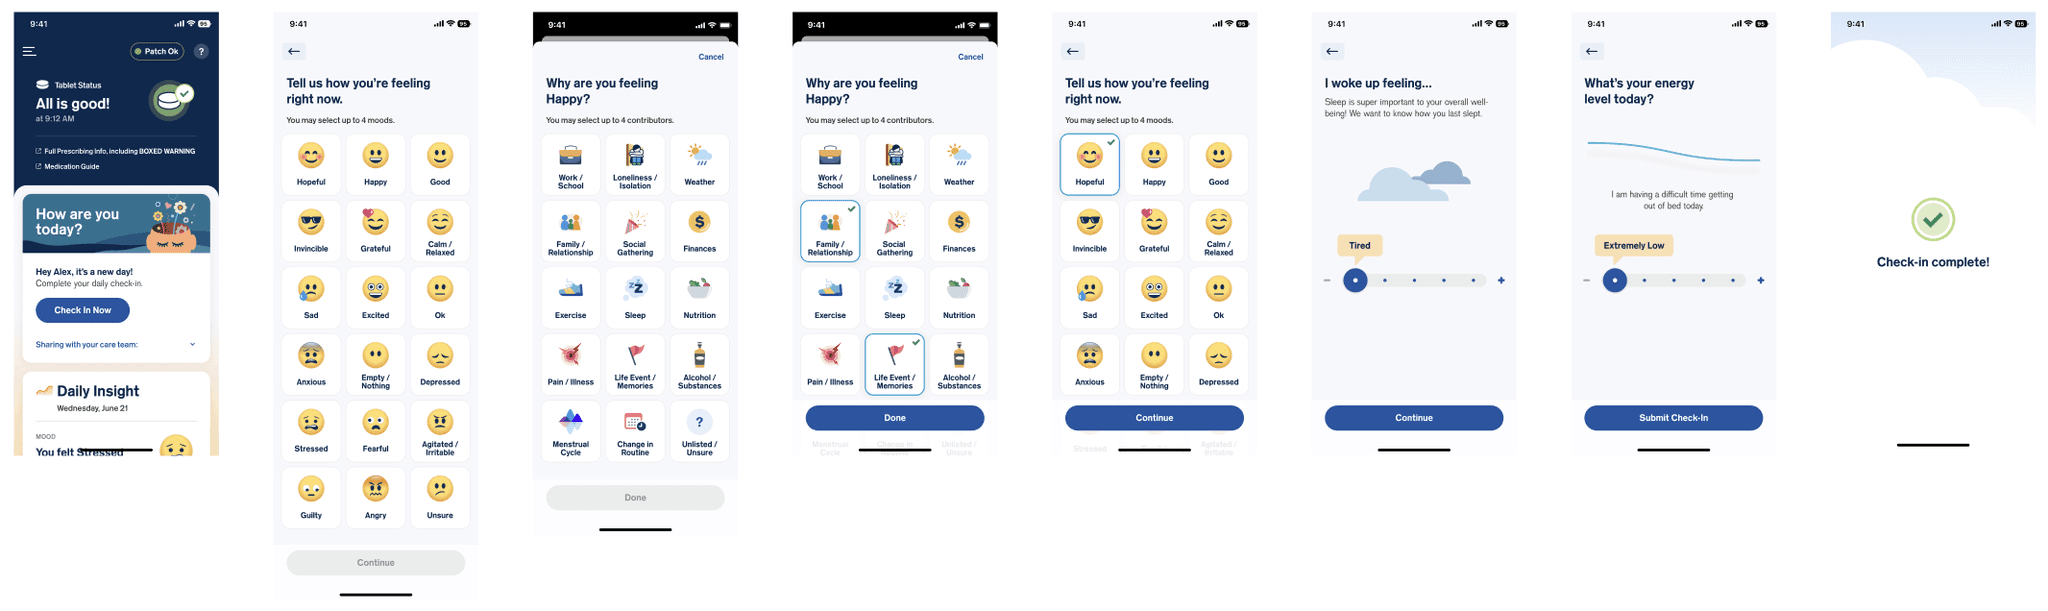
When we changed the experience from a higher level (by allowing for multiple entries per day) we no longer had to allow for all entries in one flow. That means we could auto-advance users to the next steps without hitting a "next" button. Of course, the speed of that makes edit-ability an important feature, but that also dovetailed nicely with our single-page optimized check-in flow.
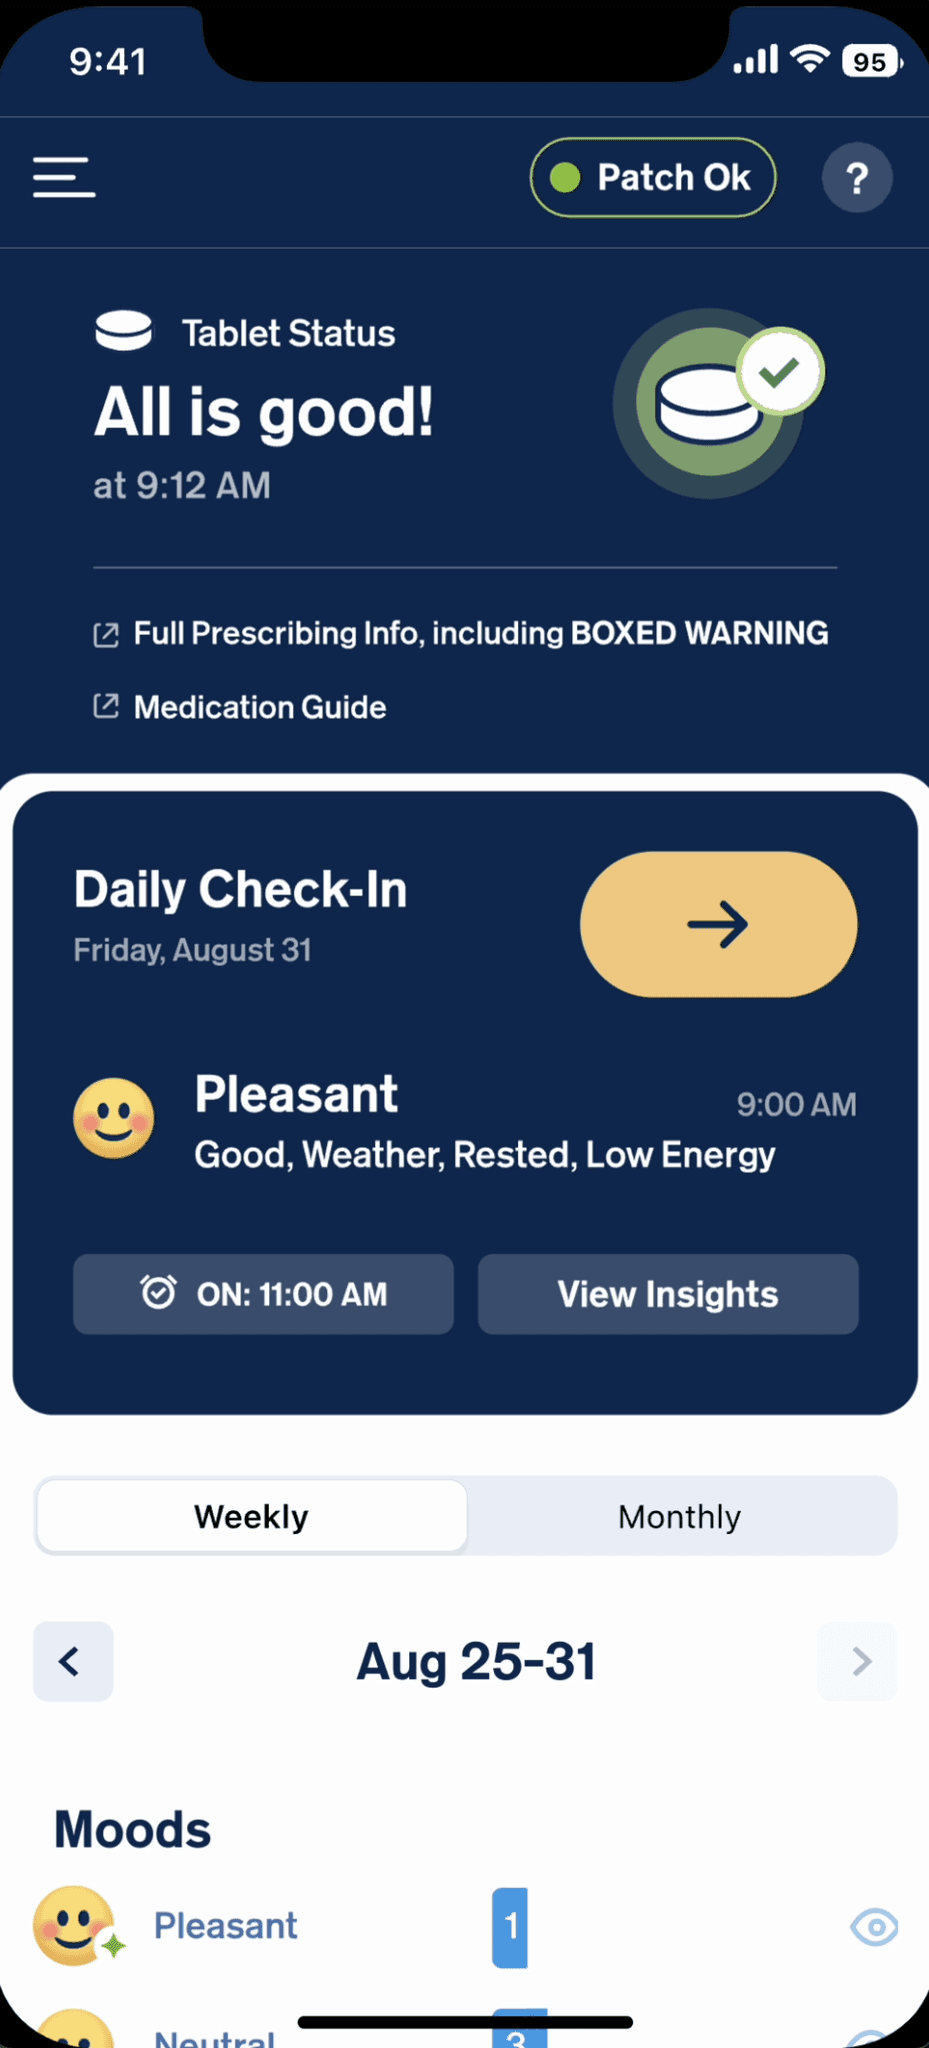
Better Dashboarding
Moods, according to psychological literature, are marked by a positive or negative valence, typically last for days, and don't necessarily have environmental triggers. Emotions and feelings, however, are fleeting, often triggered by external or internal stimuli (lack of sleep, social issues, etc.). It was important for us to collect the mood information and to frame it contextually using the emotion/environmental trigger information.
Our team had to convince the client that their application was actually incorrectly using the term "mood," and that actually collecting mood would have a hugely beneficial impact on the experience.
1) Collecting an ordinal variable allows you to plot it, which allows our users to see trends. Try plotting "stressed" or "anxious" alongside "sad" or "angry." Does that on the positive side or the negative side?
2) Collecting a variable with only three options (pleasant, neutral, unpleasant) allows for repetition, a key ingredient to seeing patterns that eluded our users.
You might be thinking, this is a lot of data, and you'd be right. We didn't stop at just offering basic transparency into trends, patterns, and logged entries over time. We added intelligent insights to them in a section above. For more on that, check out the video presentation above (around 7:00).
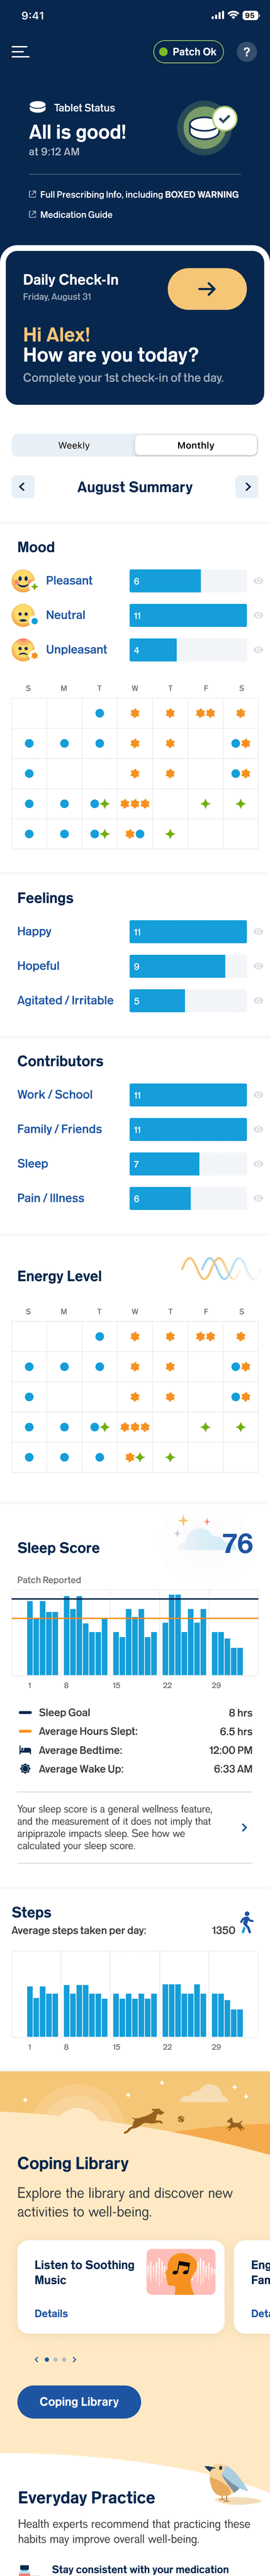
The next thing we were able to do here was to enable a feature that allowed users to crosscut their data based on a given factor. For instance, if I select "Pleasant," all of my data for instances where I selected that entry also highlight, answering key questions about what my sleep my have been like, my activity on those days, my energy level, my feeleings, and so on. This shows patterns unlike any of the competitors in this space.
Chart filtering to show patterns.

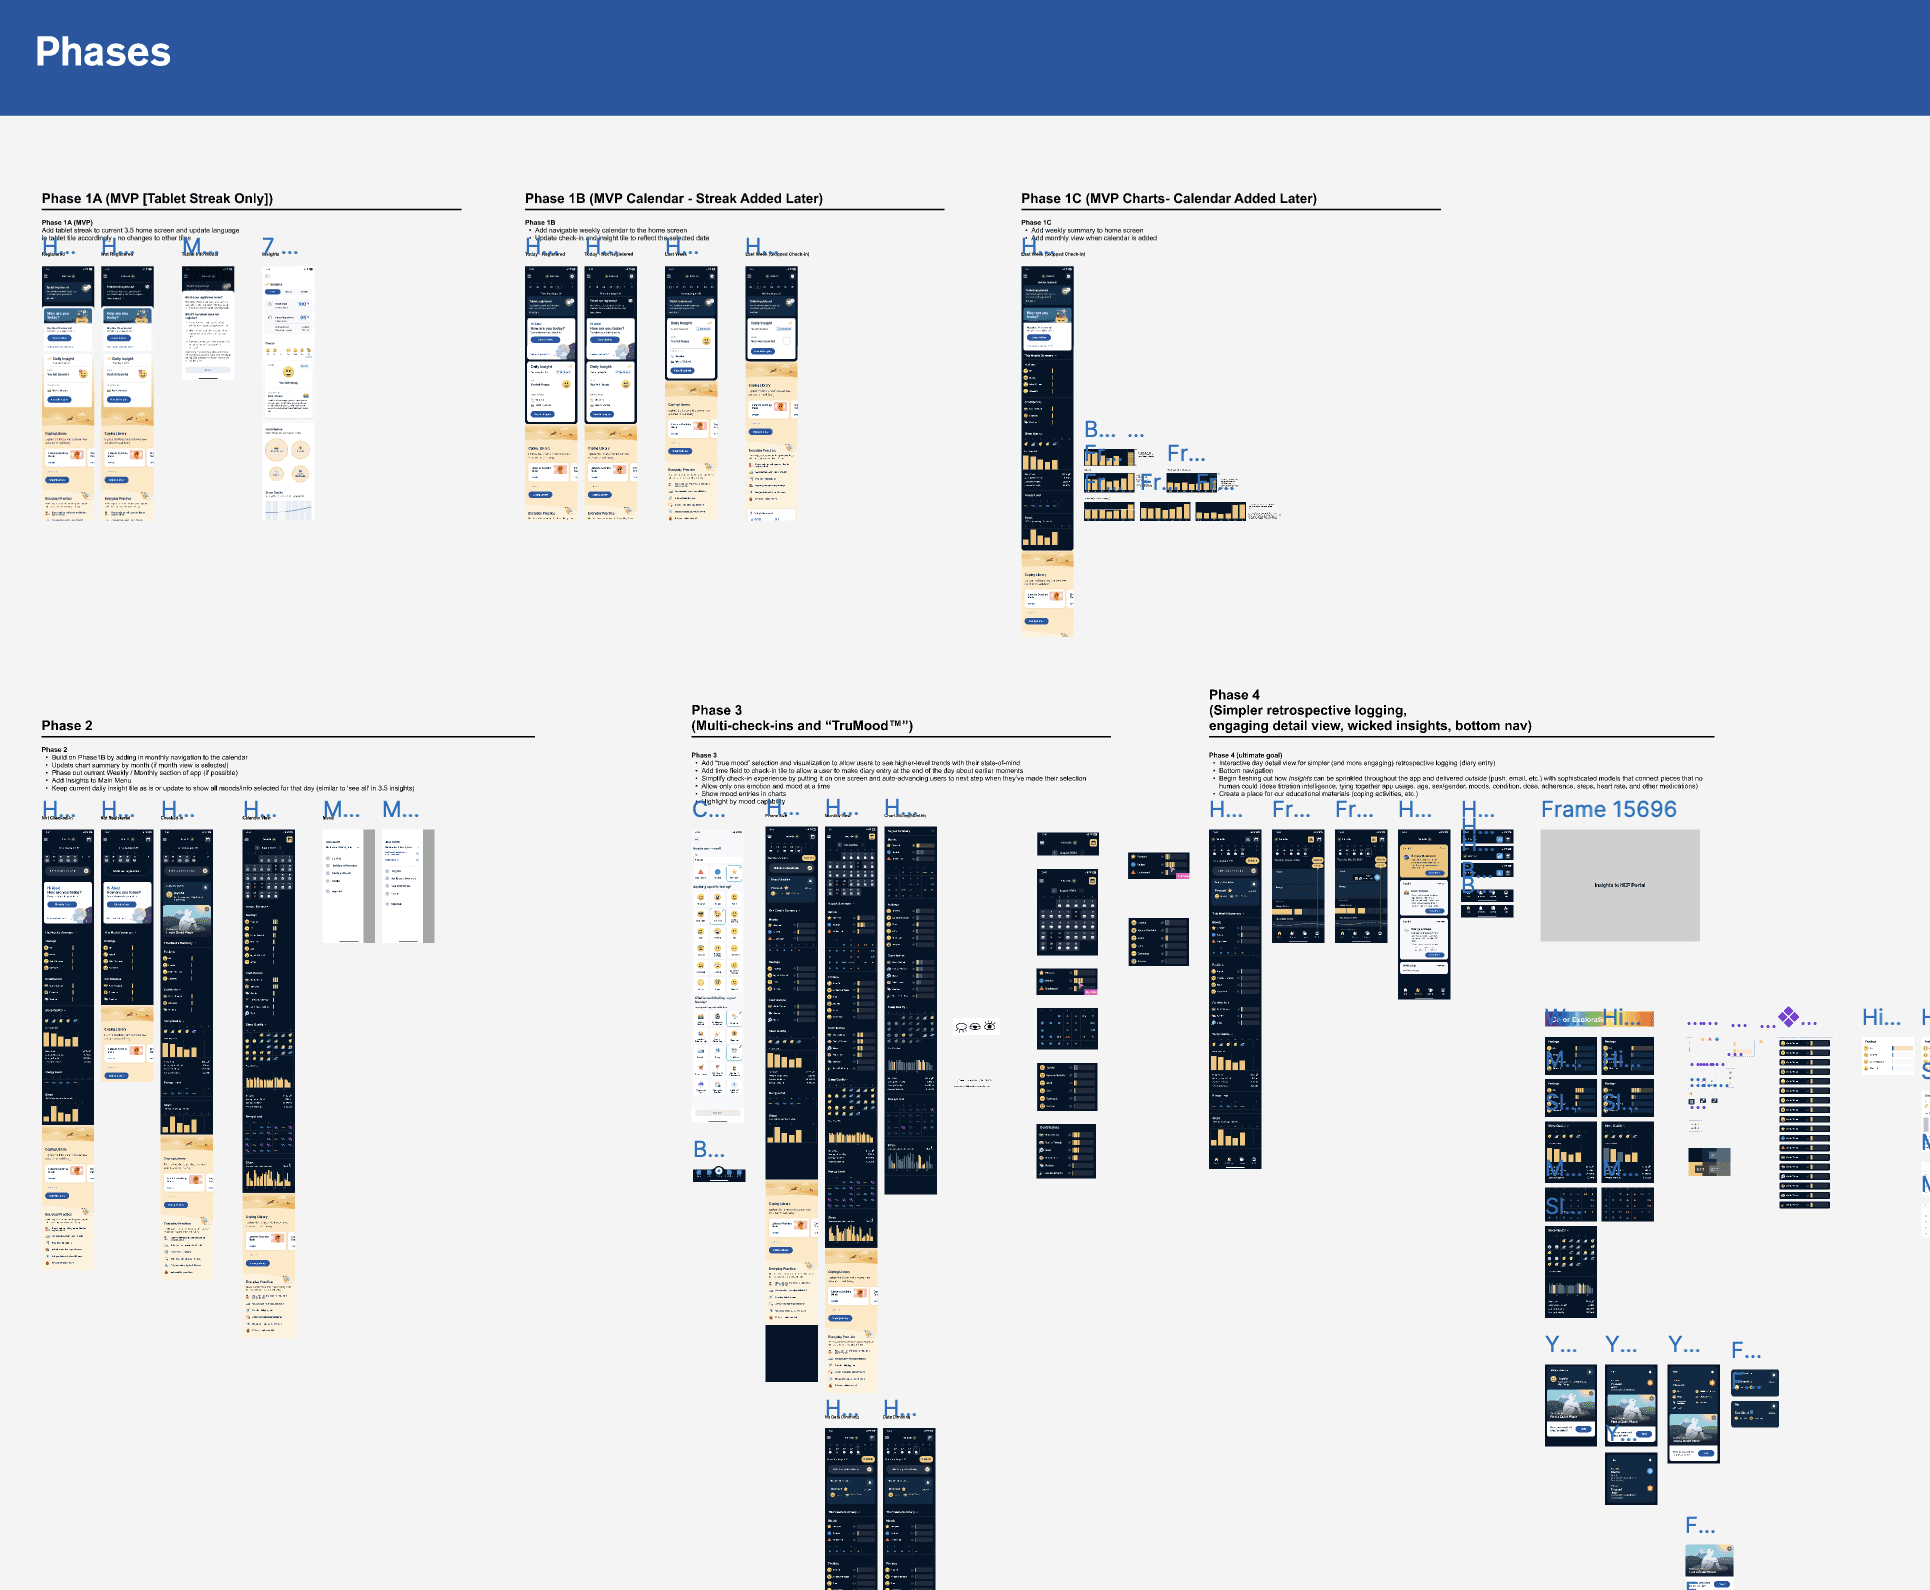
Naturally, this wasn't an effort to be accomplished in one fell swoop. We needed to break it down based on a variety of parameters, one of which was the timeline for FDA submission. We needed to further ideate on a micro-level with junior designers, build a research plan for the overarching strategy as well as deciding which analytics we would collect at each stage. Basically, how do we ensure that we progressively add value without having to backtrack? What are some contingencies and plans for those?
Releases.